
What is Data Warehouse
A data warehouse is a type of data management system that is designed to enable and support business intelligence activities. It aggregates data from different sources into a single, central data store. It is Online Analytical Processing(OLAP) system. Data is structured in form of dimensional model.
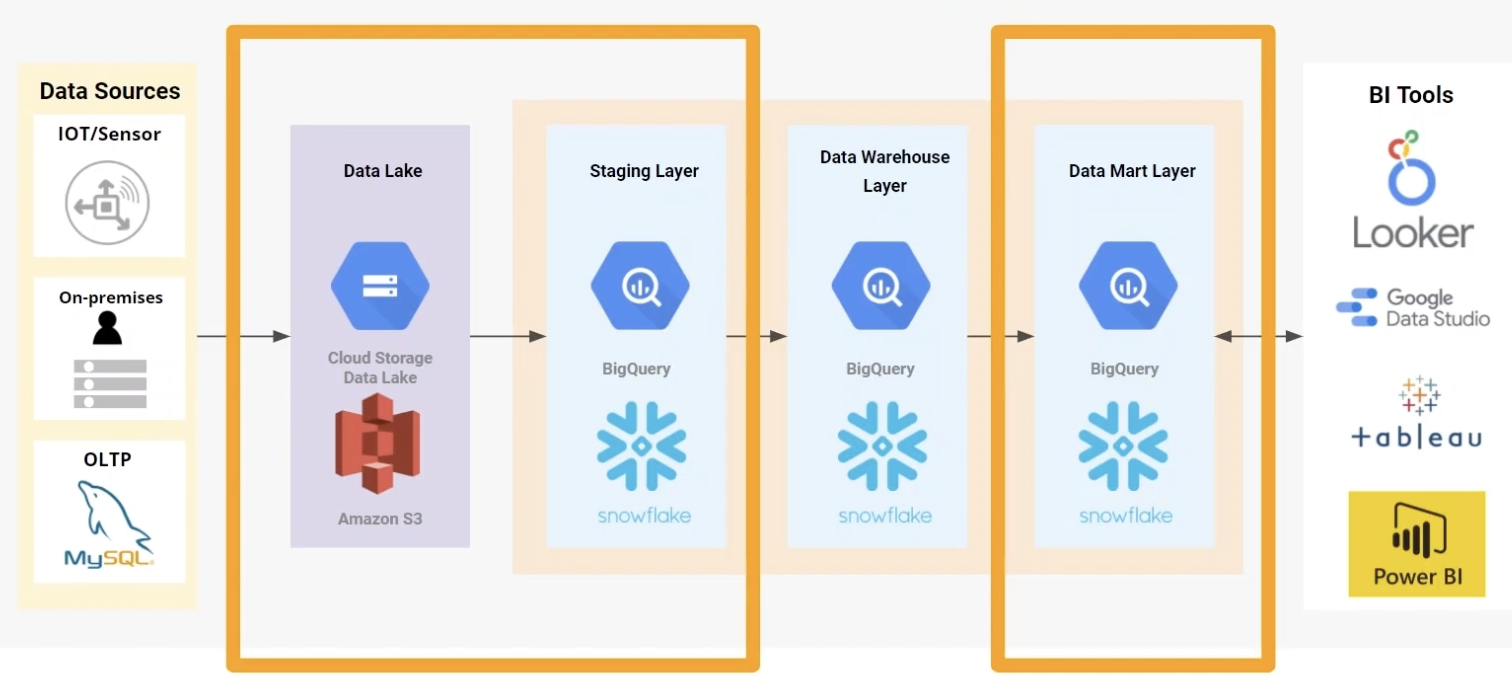
The most popular architecture is three-tier data warehouse architecture, which includes bottom tier, middle tier and top tier.
OLTP vs OLAP
| OLTP(online transaction processing) | OLAP(online analytical processing) | |
|---|---|---|
| Storage type | Row store | Column Store |
| Function | Operational | BI, Decision making, Analysis |
| Data source | Current data, Operational Data, Day to Day | OLTP, third-party systems, IOT |
| Query Types | Simple, Multiple joins, return few records | Complex, less joins, return large records |
| Speed | Very fast transaction type | slow to medium depends on complexity of query |
| Database Design | Normalized (Many tables), relational | De-normalized (few tables), star/snowflake schema |
| Users | Operational users | Analysts/data scientist/data engineers |
Introduction of BigQuery
When a company starts its journey of data warehouse or data analytics, a huge chunk of time is spent in creating a data warehouse, maintaining it, using bigquery can get rid of the pain. BigQuery is
- Serverless data warehouse
- Software as well as infrastructure including scalability and high-availability
- Built-in features like
- Machine learning
- Geospatial analysis
- Business intelligence
- BigQuery maximizes flexibility by separating the compute engine that analyzes your data from your storage

Bigquery generally caches data, you can disable it in query settings ->cache preference.

Bigquery provides a lot of public data. We can search it and explore the data.

BigQuery Pricing
- On demand pricing E.G. $5 per TB. The first 1TB per month is free.
- Flat rate pricing Based on number of pre requested slots. Monthly cost $2000, 100 number of slots
Create external tables using query
-- Create external table referring to gcs path
CREATE OR REPLACE EXTERNAL TABLE `data-engineering-demo-375721.dezoomcamp.external_fvh_rides`
OPTIONS (
 format = 'CSV',
 uris = ['gs://dtc_data_lake_data-engineering-demo-375721/data-engineering-demo/data/fhv/fhv_tripdata_2019-*.csv.gz']
);
It takes only a few seconds to create the external table. External table size 0B, long-term storage size 0B, But it can’t detect the rows or the table size. Because the table is not in bigquery. It is in an external system such as google cloud storage.

Partitioning and Clustering
Partition is a huge advantage so that Big Query doesn’t need to run over the whole table. For example, when most of the queries are based on date und use it as a filter. You can partition a table based on Integer column, or time-unit column, or ingestion time.

Clustering tables means sort by clustered columns. In this way it can also improve query performance and reduce query costs.

-- Create a partitioned table from external table
CREATE OR REPLACE TABLE `data-engineering-demo-375721.dezoomcamp.fvh_rides_partitioned`
PARTITION BY
 DATE(pickup_datetime) AS
SELECT * FROM `data-engineering-demo-375721.dezoomcamp.external_fvh_rides`;


-- Creating a partition and cluster table
CREATE OR REPLACE TABLE `data-engineering-demo-375721.dezoomcamp.fvh_rides_partitoned_clustered`
PARTITION BY DATE(pickup_datetime)
CLUSTER BY affiliated_base_number AS
SELECT * FROM `data-engineering-demo-375721.dezoomcamp.external_fvh_rides`;
BigQuery best practice
Cost reduction- Avoid SELECT *
- Price your queries before running them
- Use clustered or partitioned tables
- Use streaming inserts with caution
- Materialize query results in stages
- Filter on partitioned columns
- Denormalizing data
- Use nested or repeated columns
- Use external data sources appropriately
- Don’t use it, in case u want a high query performance
- Reduce data before using a JOIN
- Do not treat WITH clauses as prepared statements
- Avoid oversharding tables
- Avoid JavaScript user-defined functions
- Use approximate aggregation functions (HyperLogLog++)
- Order Last, for query operations to maximize performance
- Optimize your join patterns
- As a best practice, place the table with the largest number of rows first, followed by the table with the fewest rows, and then place the remaining tables by decreasing size.
Machine Learning in BigQuery
Data Analysts and managers can use BigQuery to build ML models and it requires no knowledge of python or Java. It’s not necessary to export data into a different system.
ML in BigQuery is free for the 10GB per month of data storage and the 1TB per month of queries processed.
Steps to build a ML steps:
- Select relevant columns (features)
- Create a regression or classification model you selected
- Evaluate the model
- Predict the results with the model
- If necessary, fine tuning the hyperparameters.
-- CREATE A ML TABLE WITH APPROPRIATE TYPE
CREATE OR REPLACE TABLE `taxi-rides-ny.nytaxi.yellow_tripdata_ml` (
`passenger_count` INTEGER,
`trip_distance` FLOAT64,
`PULocationID` STRING,
`DOLocationID` STRING,
`payment_type` STRING,
`fare_amount` FLOAT64,
`tolls_amount` FLOAT64,
`tip_amount` FLOAT64
) AS (
SELECT passenger_count, trip_distance, cast(PULocationID AS STRING), CAST(DOLocationID AS STRING),
CAST(payment_type AS STRING), fare_amount, tolls_amount, tip_amount
FROM `taxi-rides-ny.nytaxi.yellow_tripdata_partitoned` WHERE fare_amount != 0
);


-- CREATE MODEL WITH DEFAULT SETTING
CREATE OR REPLACE MODEL `taxi-rides-ny.nytaxi.tip_model`
OPTIONS
(model_type='linear_reg',
input_label_cols=['tip_amount'],
DATA_SPLIT_METHOD='AUTO_SPLIT') AS
SELECT
*
FROM
`taxi-rides-ny.nytaxi.yellow_tripdata_ml`
WHERE
tip_amount IS NOT NULL;


-- CHECK FEATURES
SELECT * FROM ML.FEATURE_INFO(MODEL `taxi-rides-ny.nytaxi.tip_model`);


-- EVALUATE THE MODEL
SELECT
*
FROM
ML.EVALUATE(MODEL `taxi-rides-ny.nytaxi.tip_model`,
(
SELECT
*
FROM
`taxi-rides-ny.nytaxi.yellow_tripdata_ml`
WHERE
tip_amount IS NOT NULL
));


-- PREDICT THE MODEL
SELECT
*
FROM
ML.PREDICT(MODEL `taxi-rides-ny.nytaxi.tip_model`,
(
SELECT
*
FROM
`taxi-rides-ny.nytaxi.yellow_tripdata_ml`
WHERE
tip_amount IS NOT NULL
));


-- PREDICT AND EXPLAIN
SELECT
*
FROM
ML.EXPLAIN_PREDICT(MODEL `taxi-rides-ny.nytaxi.tip_model`,
(
SELECT
*
FROM
`taxi-rides-ny.nytaxi.yellow_tripdata_ml`
WHERE
tip_amount IS NOT NULL
), STRUCT(3 as top_k_features));


-- HYPER PARAM TUNNING
CREATE OR REPLACE MODEL `taxi-rides-ny.nytaxi.tip_hyperparam_model`
OPTIONS
(model_type='linear_reg',
input_label_cols=['tip_amount'],
DATA_SPLIT_METHOD='AUTO_SPLIT',
num_trials=5,
max_parallel_trials=2,
l1_reg=hparam_range(0, 20),
l2_reg=hparam_candidates([0, 0.1, 1, 10])) AS
SELECT
*
FROM
`taxi-rides-ny.nytaxi.yellow_tripdata_ml`
WHERE
tip_amount IS NOT NULL;
Reference:
❤️ Please visit my home page for more contents. I look forward to connecting with you via LinkedIn.
❤️ You might like Week 2 data engineering zoomcamp notes: Prefect.
