
Analytics Engineering Basics
Analytics Engineers are between Data Engineers and Data analysts. He/she introduces the good software engineering practices to the efforts of data analysts and data scientists.
Some key skills of analytics engineers are:
- SQL mastery, data transformation, data warehouse, data modelling
- Data Orchestration, business intellignce tools, version control, communication
- Programming, CI/CD, data engineering principles, security & governance
Tools for analytics engineers:
- Data loading
- Data storing -> cloud data warehouses like snowflake, bigquery, redshift
- Data modelling -> dbt or dataform
- Data presentation -> data studio, looker, tableau
Data Modelling Concepts
A data model
- Foundation to build DWH (Data warehouse)& BI solutions
- Primary goal of the data model is to act as a blueprint
- Helps build conceptual, logical, physical models and define relationships
ETL vs ELT
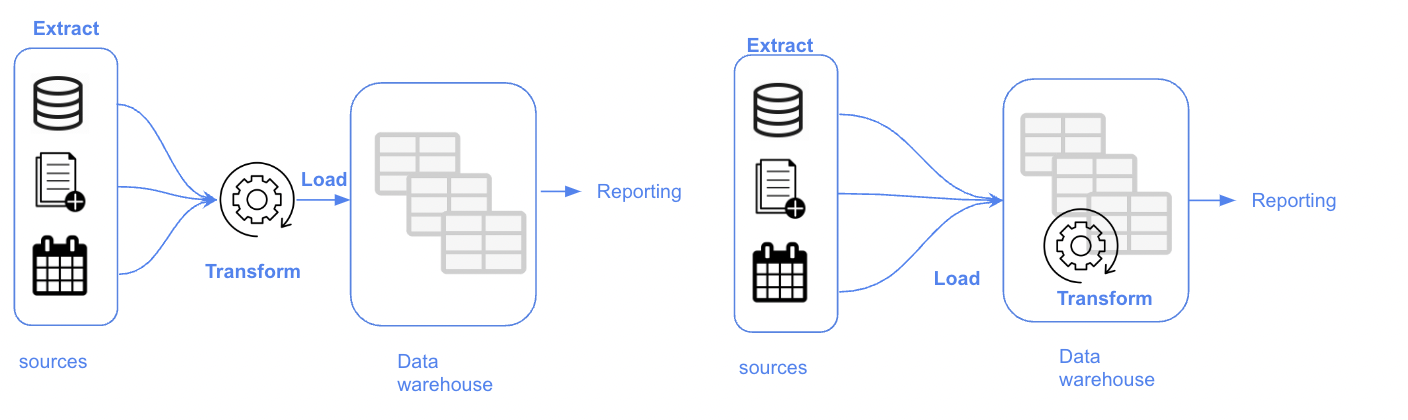
| ETL | ELT | |
|---|---|---|
| Volume | Small / medium data volume | Large data volumne |
| Analysis time | Fast analysis | Slower than ETL |
| Data Type | Prefer structured data | Structured & unstructured data |
| Cost | High-cost | Low-cost |
| Maintenance | High maintenance due to on-premise solutions | Low-Maintance due to cloud solutions |
| Availability | Only required for reporting/analysis | Everything can be accessed from data lake |
Data warehouse design methodologies
- Inmon
- Kimball
- Data Vault
- OBT
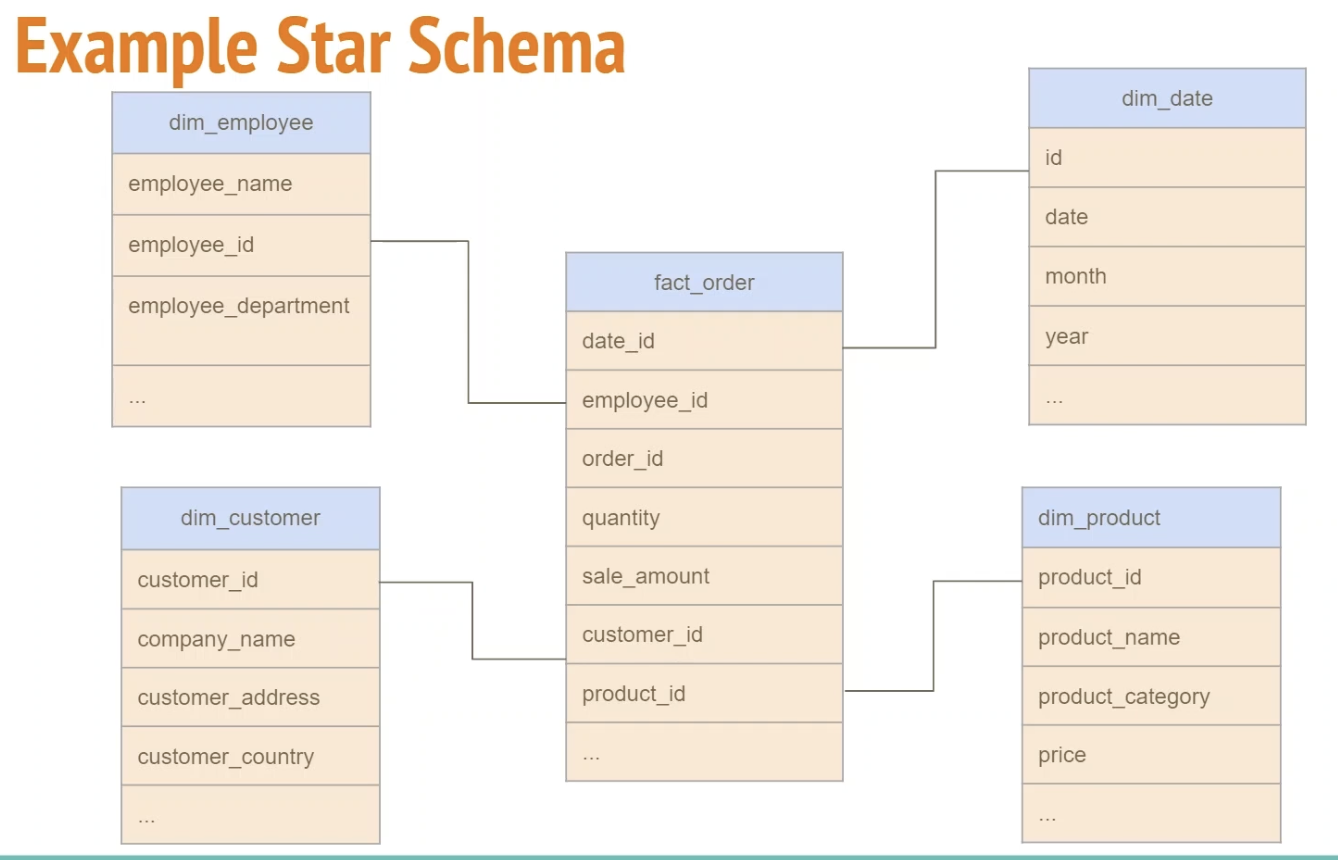
Kimball’s Dimensional Modelling
Kimball methodology is created by Ralph Kimball. It starts with identifying key business process and requirements (Bottom-up). It prioritize user understandability and query performance over non redundant data (3NF). The dimensional model is star-schema design (denormalised). The model design is built on fact and dimension tables.
Fact tables vs dimension tables
| Fact tables | Dimension tables |
|---|---|
| Measurements, metrics or facts | Provides context to a business process |
| Corresponds to a business process | Corresponds to a business entity |
| “Verbs” | “Nons” |
| fact table is surrounded by dimension tables |
Example star schema
Kimball architecture
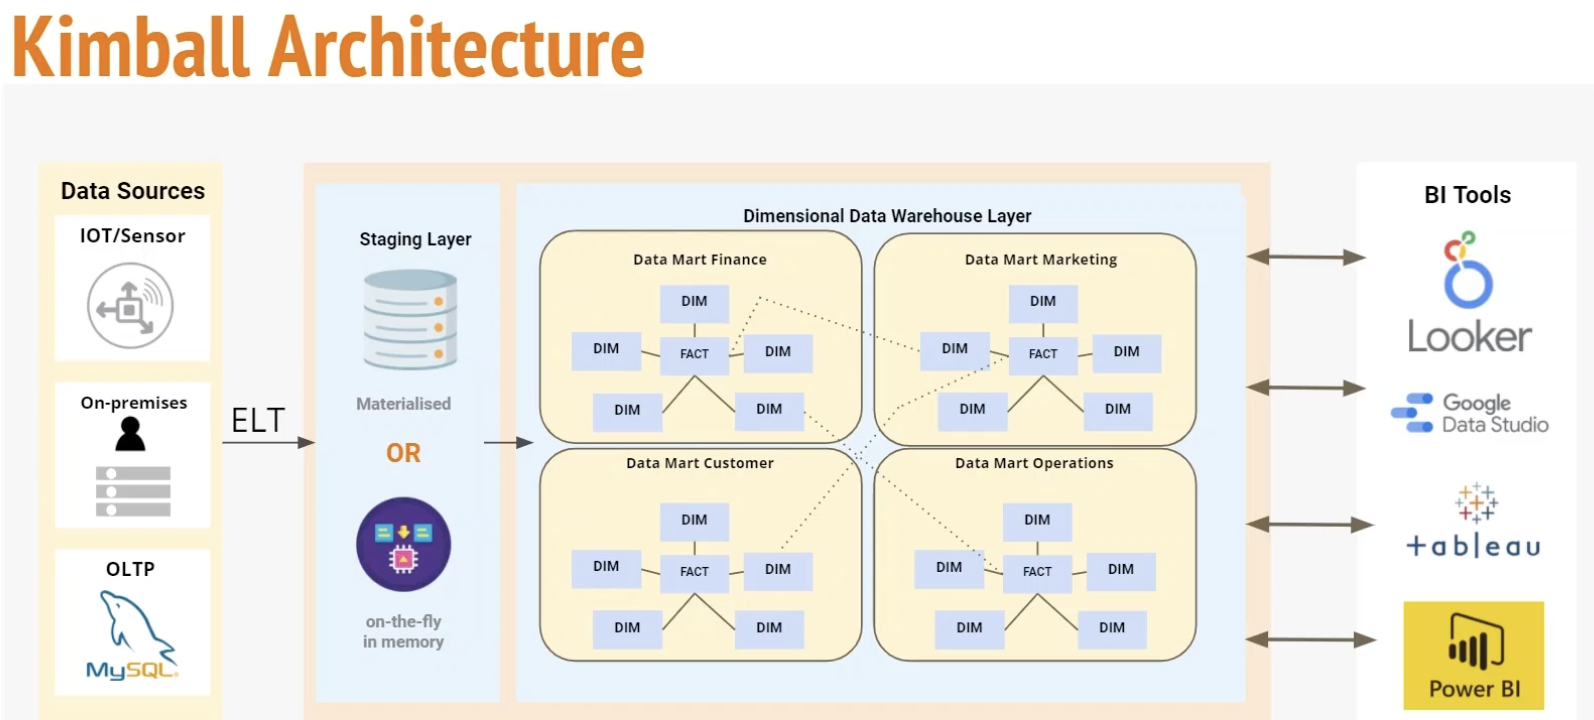
- Staging area: contain raw data and not meant to be exposed to everyone
- Processing area: do data modelling
- Presentation area: final presentation of the data, exposure to business.
Introduction of dbt
dbt stands for data built tool.
dbt is a transformation tool that allows anyone that knows SQL to deploy analytics code following software engineering best practices like modularity, portability, CI/CD, and documentation.
dbt cloud vs dtb core
| dbt Cloud | dbt Core |
|---|---|
| Web-based IDE to develop, run and test a dbt project | Builds and runs a dbt project (.sql and .yml files) |
| Jobs orchestration | Includes SQL compilation logic, macros and database adapters |
| Logging and Alerting | Load Google analytics asynchronously |
| Integrated documentation | Includes a CLI interface to run dbt commands locally |
| Free for individuals (one developer seat) | Opens source and free to use |
Start a new dbt project in dbt cloud
When you signed in, the first step is to create a project following the steps:
-
Give a name to your project, choose a warehouse, a development environment is automatically created.

-
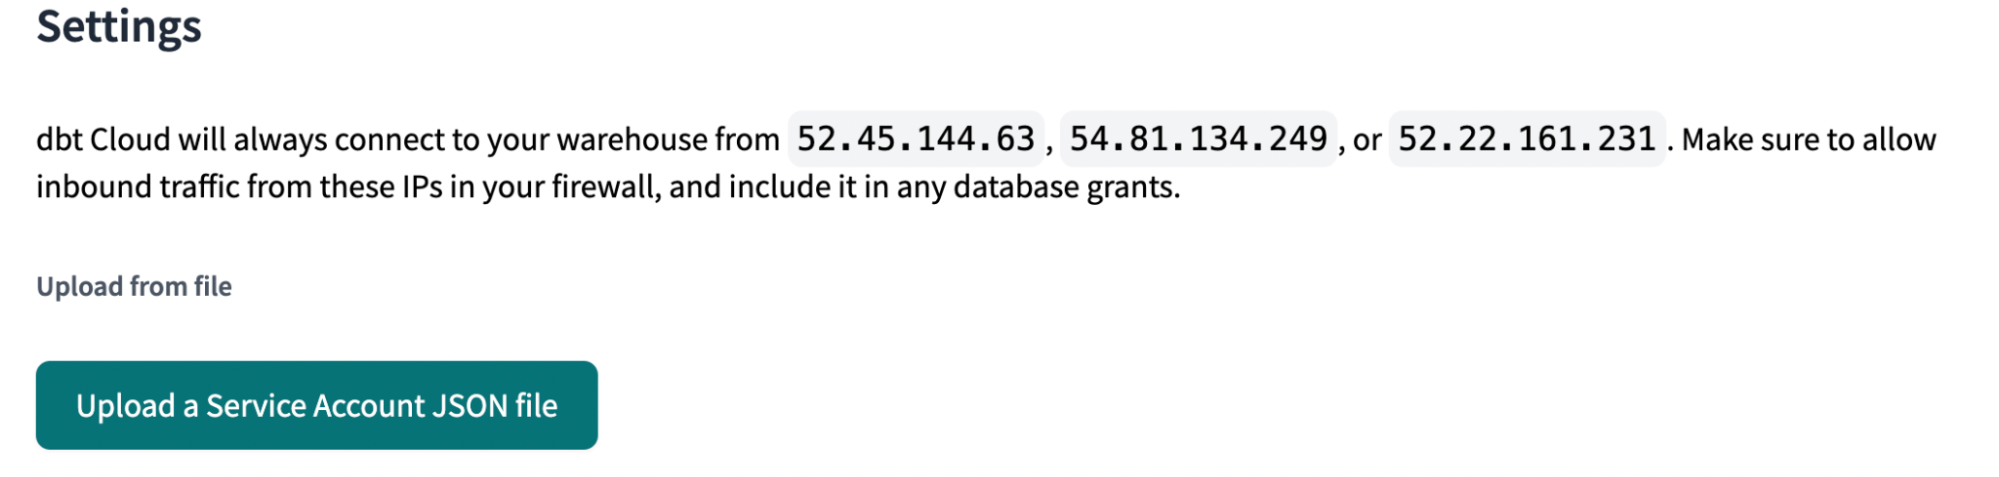
For BigQuery connection, we will upload the service account key in json.
-
Set the data location to the same location where the dataset in BigQuery is located.

-
Test the connection

-
Link dbt project to a GitHub repository
- Create a GitHub repository to deploy the project.
- Go to “Profile” -> Linked accounts -> Choose Github -> Select the repository
After all these steps, your project is ready.
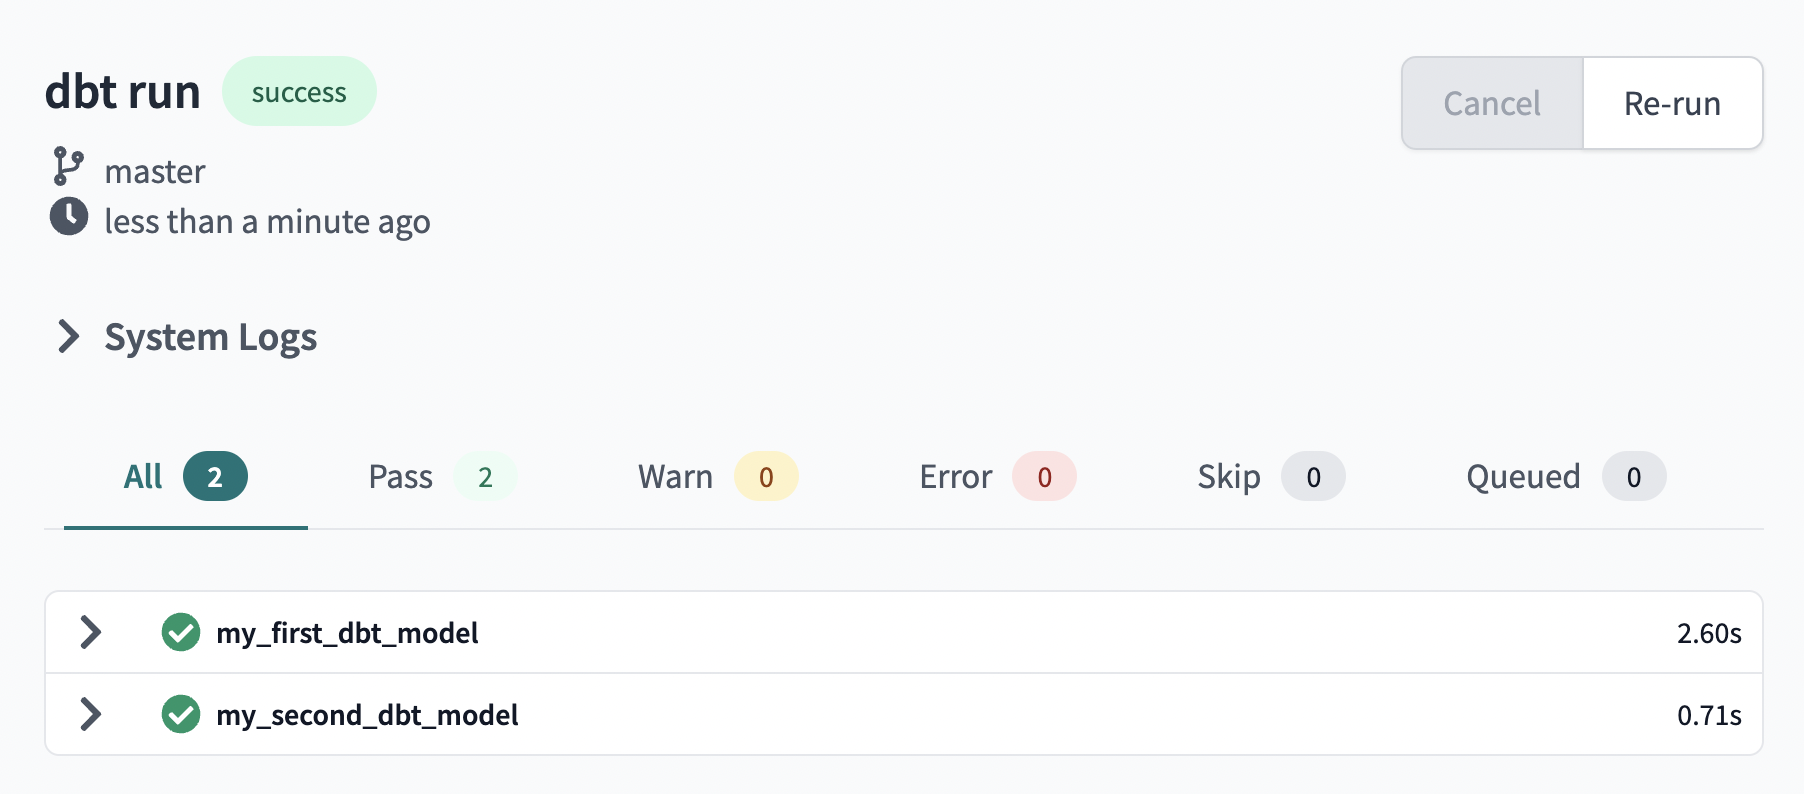
- In development, initialise the project and run
dbt runto run your first model in the example model dbt provides.
Jinja and macros
In dbt, you can combine SQL with Jinja, a templating language. You have much more flexibility when writing your sql codes. You can use if or for loops, or use variables.
Macros in Jinja are similar to functions and can be reused across different models. They can return codes and are very similar to python chain. You can create a sql file under the macros folder. For example:
 {#
    This macro returns the description of the payment_type
#}

{% macro get_payment_type_description(payment_type) -%}

    case {{ payment_type }}
        when 1 then 'Credit card'
        when 2 then 'Cash'
        when 3 then 'No charge'
        when 4 then 'Dispute'
        when 5 then 'Unknown'
        when 6 then 'Voided trip'
    end

{%- endmacro %}
Then we can call the macro in our dbt models.
Packages
Like libraries in other programming languages, we can use packages in dbt_utils instead of writing everything in macros ourselves.
Imported in the packages.yml file and imported by running dbt deps.
An example of packages.yml file:
packages:
  - package: dbt-labs/dbt_utils
    version: 0.8.0
It creates a dtb_packages folder.
Variables
Variables are useful for defining values that be used across the project. You can define variable either in the dbt_project.yml file or on the command line.
Define variables in dbt_project.yml file:
vars:
  payment_type_values: [1, 2, 3, 4, 5, 6]
Calling the variable using
{% var('is_test_run', default=true) %}
In command line call the variable
dbt run --select stg_green_tripdata --var ‘is_test_run:false’
Tests and Documentation of dbt models
Tests
Tests are defined on a column in the .yml file. Dbt provides basic tests to check if the column values are unique, not null, accepted value, a foreign key to another.

Documentation
Generate documentation for dbt project and render it as a website
Information about your project and your data warehouse.
Dbt docs can be hosted in dbt cloud.

Deployment
Deployment means to run dbt models in production, to set up a system to run a scheduled dbt job automatically.
Step 1: Create a production environment.
Choose deployment type.

Step 2: Create a job.
You can set up the triggers with Cron or with Schedule. Add the commands to run in the job dbt build.

Step 3: View the job detailed history.

Visualization with Google studio
Google data studio is an easy free tool to visualize your data. The first step is to import data from our BigQuery tables to Data studio. I will not cover how to build a dashboard here.

Reference:
- Data Engineering Zoomcamp in Github
- dbt official documentation
- Analytics Engineering Bootcamp in Udemy
- Cover picture from Pete Linforth on Pixabay
- Jinja template
❤️ Please visit my home page for more contents. I look forward to connecting with you via LinkedIn.
❤️ You might like
